

Bitcoin fans proudly boast Bitcoin’s 1 trillion dollar market cap. And a 3 trillion dollar market capitalisation for all registered coins. Impressive numbers.
The market capitalisation (market cap) metric is widely used in technical analysis and on cryptocurrency news sites. It is the market’s choice, you can calculate it very easily for any coin, and it often gives a good enough impression of the popularity of the coin with the overall public.
The market capitalisation of a cryptocurrency like Bitcoin is calculated as the number of issued coins times the most recent average price at the exchanges.
Bitcoin with 56.000 dollars times 18 million Bitcoin, has a 1.05 trillion market cap today. You can check a lot of the current cryptocurrrency data over at coinmarketcap.

Market cap for size
That is the idea in the market, the coin with the highest market cap is the ‘biggest’ coin. On the coinmarketcap site, everything is calculated compared to market cap.
I never cared much about the market cap metric. I am more interested in the cashflow, and the actual invested capital of a coin. The actual invested capital is to my opinion a better indication of the size of a coin.
How 'big' is Bitcoin ?
Some government economists complained about cryptocurrency being a 2 trillion dollar threat to the economy. They refered to the subprime mortgage market that was a 2 trillion dollar market that went sour and caused the 2008 financial crisis. They wanted to claim Bitcoin and other cryptocurrencies pose a similar threat to the world economy, based on the cryptocurrencies having a 3 trillion dollar market cap and that being roughly equal to the 2 trillion dollar bad mortgage debts.
Bitcoin may have a one trillion dollar market cap. And in general people pretend that is how ‘big’ Bitcoin is. The market cap is not the best metric for the actual size of a coin. The total invested capital is a better metric. A trillion dollar market cap that doesn’t mean people also have one trillion dollar invested in Bitcoin. People have far less invested in Bitcoin than that one trillion dollars.
That sparks the question :
How much did people invest in Bitcoin ?
Bitcoin : the actual invested capital
Let us take a look at the total invested capital.
The trade volume per period in Bitcoins times the average price of the period gives us an estimate of the invested capital per each period. And summing that for all periods. gives a good approximation of what people actually invested as capital in Bitcoin. What did the wallet owner pay for the Bitcoins ? That sum of invested capital shows you the actual stake of the wallet-owners in the project.

Bitcoin : active traded coins
When you check the daily exchange volumes on coinmarketcap, the relative trade volume of Bitcoin is often 2 to 3%, that is the number of Bitcoin being traded over the past 24 hours. 3% Bitcoins traded per day, that doesn’t mean that in 30 days 30×3 = 90% of all Bitcoins are exchanged.
Over the last month only 10% of all Bitcoins actually changed hands. So where 3% changes hands per day, in total just 10% of Bitcoins changed hands over the last month. Over the last year, an estimated 40% of all Bitcoins were exchanged.
Bitcoin : inactive coins
As said, 40% of the total coins on the market were traded in the last year. The other 60% are dormant longer than a year, basically. Some Bitcoins are stored in wallets for years on end. The most famous being the Satoshi wallet with 1 million Bitcoins in it, frozen forever. Worth 60 billion dollars at the current market price. Like the Satoshi coins, some Bitcoins are basically never traded. They were bought or mined 10 years ago and are still with the same owner. Some of these are whales, with relative large numbers of Bitcoins.
they all have a historic price
All coins have their own historic price, either the price paid on the market, or the cost of mining the coin. Where the coins are fungible, every Bitcoin batch (transactions) has it’s own historic price. And that is how we cacalculate the actual invested capital, the sum total of the acquired and traded coins times their historic price, either the trading price or the mining cost.
market price versus historic price
That is basically what decides the gap between market cap and invested capital. The difference between market price and historic price of every portion of Bitcoin. How big is the gap between market cap and invested capital for Bitcoin ?
In order to estimate that, you will have to calculate the total invested capital. You would have to retrieve a list with all transactions, the amount of Bitcoin moved, and the historic price (or mining cost) of that amount. I do not have access to that level of detail. Unchained has that data aggregated in anonymous age-groups.
Unchained's HODL-waves
To shed some light on the matter, I got a graph with some Bitcoin data from Unchained : the HODL-waves :
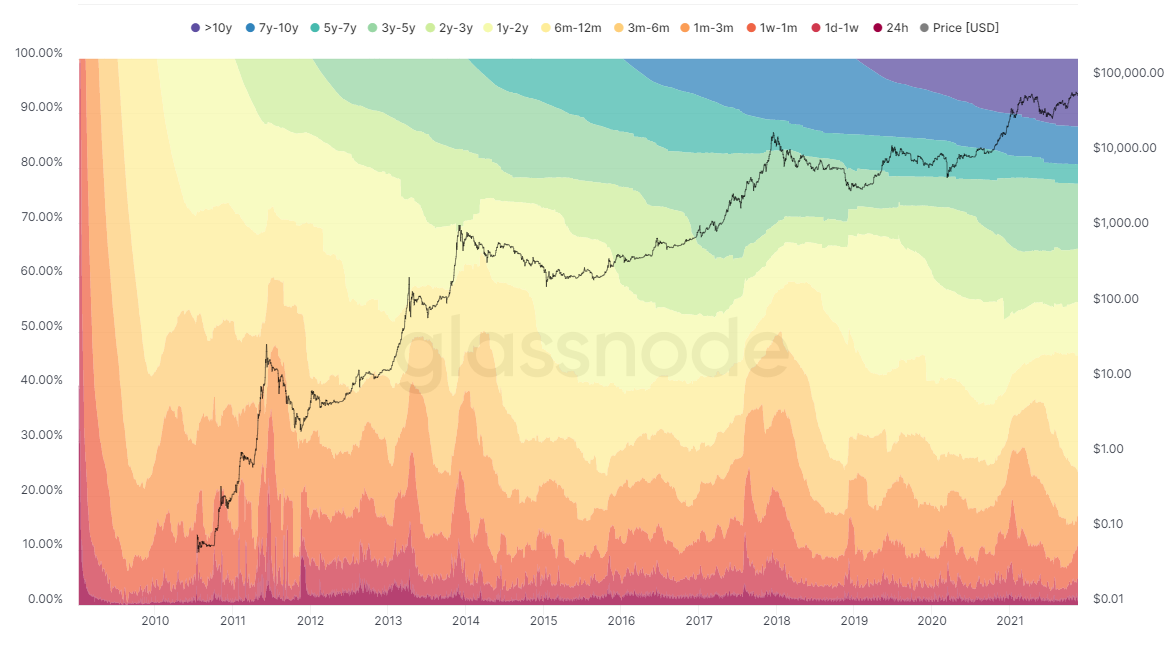
From the graph, per date-point, you can list of that date-point with the historic price, with a list of groups based on storage duration and with their relative size in percentage :

This was yesterdays graph (22 november 2021)
Estimating the total invested capital of Bitcoin based on HODL-waves
You can get a good indication of the total invested capital in Bitcoin by extracting some of the data from this graph. I took the percentage per storage-duration-group including the prices per end of the periods, and estimated the number of coins based on the percentages times 18 million mined Bitcoins. I calculated an average price per period, and from that, calculated the estimated total invested capital per storage-duration-group (the HODL-waves).
| total mined | 18000000 | |||||||
| last traded: | period | price | ||||||
| (hodl-wave) | coins | start | end | start | end | average | estimated invested capital ($) | |
| >10 years ago | 12,43% | 2237400 | 2009 | 2011 | 0 | 0,30 | 0,15 | 335.610 |
| 7-10 | 6,86% | 1234800 | 2011 | 2014 | 0,30 | 675 | 337,65 | 416.930.220 |
| 5-7 | 3,63% | 653400 | 2014 | 2016 | 675 | 455 | 565 | 369.171.000 |
| 3-5 | 11,85% | 2133000 | 2016 | 2018 | 500 | 13900 | 7200 | 15.357.600.000 |
| 2-3 | 9,75% | 1755000 | 2018 | 2019 | 13900 | 3900 | 8900 | 15.619.500.000 |
| 1-2 | 9,85% | 1773000 | 2019 | 2020 | 3900 | 7400 | 5650 | 10.017.450.000 |
| 6-12m | 21,52% | 3873600 | 2020 | 2021 | 7400 | 10900 | 9150 | 35.443.440.000 |
| 1-3mnd | 7,53% | 1355400 | 2021 | 2021 | 10900 | 58000 | 34450 | 46.693.530.000 |
| 1w-1mnd | 6,39% | 1150200 | 2021 | 2021 | 58000 | 43750 | 50875 | 58.516.425.000 |
| 1d-1w | 2,40% | 432000 | 2021 | 2021 | 43750 | 66000 | 54875 | 23.706.000.000 |
| 1d | 1,80% | 324000 | 2021 | 2021 | 66000 | 56000 | 61000 | 19.764.000.000 |
| total invested capital | 225.904.381.830 | |||||||
| invested last year | 184.123.395.000 (82%) | |||||||
That is not entirely perfect, it is a rough estimate, but it does give us an estimate of the total invested capital. The number of coins per storage duration, times the average historic price of the period, summed up. That shows there is an estimated 225 billion dollar currently invested in Bitcoins.
Investments in mining equipment and infrastructure are not counted, sec the total capital investment in Bitcoin based on the transaction amounts times the historic price per transaction on the Bitcoin blockchain. And that sums up to an estimated 225 billion dollars, 22% of the one trillion dollar market cap.
Bitcoin : the corona effect
The Unchained HODL-waves graph and data also show 184 of the 225 billion, 82% of the total invested capital, were invested only in the last year, buying 40% of the total coin supply.
Bitcoin attracted a lot of capital this year. Before corona there was an estimated 30 billion dollars total capital invested in Bitcoin, and the last two years added 194 billion. That was 10 billion in the first Corona year 2019, 35% less than a year before, probably due to the liquidity crunch, and a staggering 184 billion in the second corona year 2020.
I would guess part of the helicopter money, the Corona aid, found it’s way into Bitcoin.
Bitcoin had been building momentum, in terms of increase in invested capital. In 2019, with people prefering hard cash over Bitcoin in the Corona liquidity crunch, the growth of capital investment slowed down a bit. But the cashflow returned in abundance with a 184 billion dollar cash inflow into the market in 2020/2021.

So how big is Bitcoin ?
Based on our estimated invested capital Bitcoin is 225 billion dollars big.

Over 80% of total invested capital comes from last year’s cashflow into the market. The increase in invested capital the past year was 500%. If next year shows the same growth, the invested capital would be more than one trillion dollars. That would however require an 800 billion dollar net capital investment in Bitcoin. That might take a while.
If you calculate the expected price level based on total invested capital, 225 billion / 18 million, that is 12.500.
With 184 billion invested in the past year at an average price of 25000 dollars and the market price trading sideways at 55000 to 60000 dollars, quite near the ATH at 68.000 dollar, most of the past year’s buyers are ‘in the money’.
Should Bitcoin drop to 10.000, the level of a year ago, they are all ‘out of the money’. With an average 60% pending loss. They bought for 25.000 on average and are forced to sell at 10.000, taking a 60% average loss. That would be a 110 billion dollar pending loss for these people.
That size increase proportionally also increases related problems. Not even so much problems of the cryptocurrencies themselves, but problematic behavior of the buyers. Especialy people financing cryptos with borrowed money. That is considered a bad idea. If people borrow money from the banks or they borrow family capital to buy Bitcoin, that poses a risk. Then the bank or the family might end up taking the loss, should the market price collapse.
If Bitcoin is 30 billion in size that is a small problem. However, if Bitcoin is 225 billion in terms of invested capital, that changes the game. The small problems slowly become big problems and at some point the problems are too big for the banks to handle.
If the entire cryptoindustry is 3x the size of Bitcoin, that would put the industry at 3 trillion market cap, at a 750 billion total invested capital, of which 550 billion was invested in the past year. These numbers are fictitious, but it indicates the crypto industry is becoming big enough to seriously influence economies.
Something for the banks to worry about. A 1% exposure to Bitcoin at 30 billion is 300 million. A 1% exposure to Bitcoin at 750 billion is 7.5 billion, a 10% exposure 75 billion. If the exposure is larger, proportionally, so is the possible loss for the banks.
Trading sideways builds resistance
Currently Bitcoin is trading sideways, where the exchange price of Bitcoin is stable around 55 to 60.000 dollars. That gives the total invested capital some time to catch up to the market cap a bit more. That’s basically good, a sideways trading market near an All Time High builds a steadily growing resistance level at relative high prices.
The higher the invested capital compared to the market cap, the more resistance at higher price levels. And the less risky an investment becomes.
Does the gap between market cap and invested cap indicate low resistance ?
The gap between invested capital and market capitalization can to my opinion be indicative of a low resistance problem. If all Bitcoin were actually sold at 60.000, the price would be stable on 60.000. But as shown in the data, 2,7 million Bitcoins were bought at 15 cents, a 335.000 dollar investment. Omitting the one million coins of Satoshi, that leaves 1.7 million coins acquired on average for 15 cents that could be sold for 60.000 a piece, a 100 billion dollar yardsale. These Bitcoins were bought for an estimated 250.000 dollars in total, so that is over 100 billion pure unrealized potential profit there.
Some whales might decide to take profit.
If they tried to dump their stash, it would flood the market and cause a price collapse. The daily market is currently at 1.8%, and 1.7 million Bitcoin is 9%. Selling their Bitcoins in a short period of time would cause a rather big supply surplus and ruin the market price.
Some people say the whales regularly dump, even spread FUD to get people to dump, and then they buy the dip and increase their number of BTC. People can be really paranoid about ‘the whales’. If whales bought at 15 cents, they can sell at any price level from 60.000 to 20 cents and still make profit. Whales cashing out can cause a price drop, forcing late entrants ‘out of the money’, and potentially forcing them to sell at a loss. That makes whales a potential risk to the late entrants.
A low invested capital versus market cap might indicate most resistance is located on low price levels. Few resistance levels at higher prices. And that could indicate the presence of a lot of whales. That means a risky investment for late entrants, an unstable market, easily manipulated. Some groups could play pump and dump, or game the market by ruining the price in a coordinated dump and then buying the dip. Any kind of games that makes them a profit and stuffs the sheeple with the loss. Often there is also little daily trade in the coin.

A relative high invested capital indicates a relative safe market
I myself often check the daily trade volume of coins over the past weeks. If it is stable above 0.5%, it is a live and liquid market. I want to see a 10++ million dollar trade per day, at least. If there is a steady inflow of cash at some price level, there is a resistance level building, and with rising prices, that also means the total invested capital catches up to the market cap. Then you can more safely speculate on the price continuing to increase. Keep watching the cashflow, net in or out of the market. Once the cashflow dries up, consider getting out of the coin. Follow the money. Find out where the cash is flowing and speculate on these coins.
It won’t get you the 100x increases, but these investments are relative less risky investments, with higher resistance levels in the market. The coins could make you a few percent profit a day, perhaps, in a bull market. Compounding profit can also get you quite wealthy after a while. With less risk.
